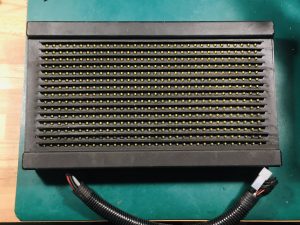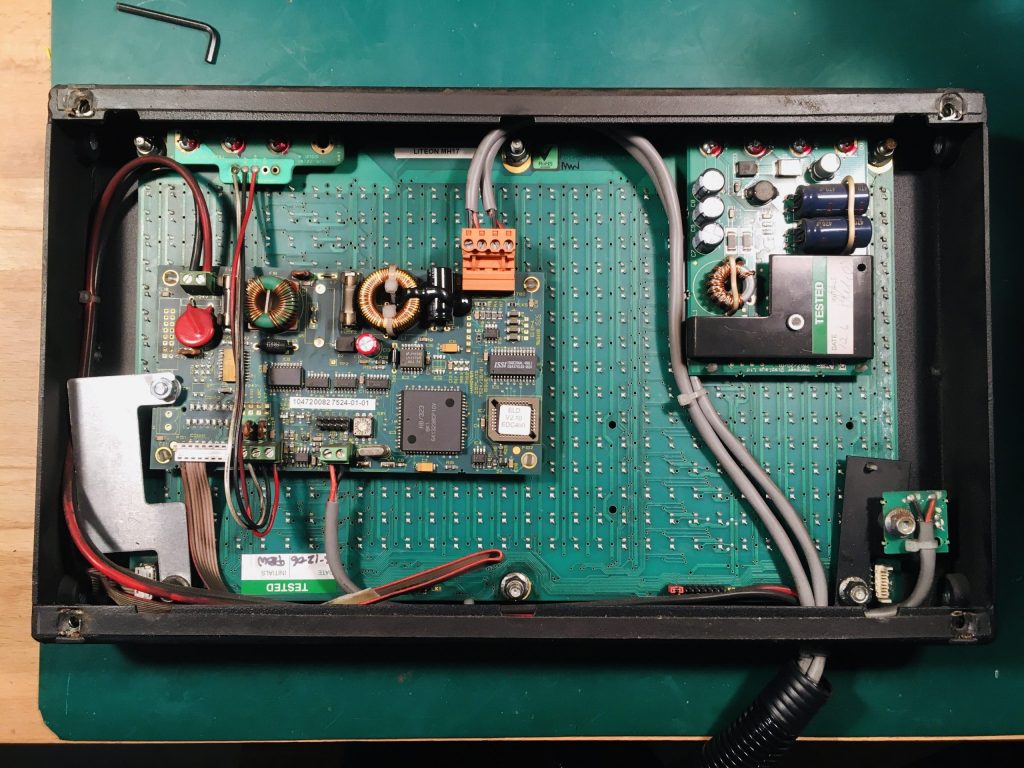


This sign is programmable via RS485 (the orange connector) but uses proprietary hardware and software so is ripe for reverse engineering. The 8 pin ribbon cable to the display board suggests a serial protocol and probing with an oscilloscope showed 0-5V digital signals. Time to attach a logic analyser.
Here is the overview on start-up:

This looks like some initialisation data and then regular data transmission every second. There is a 100Hz pulse train on pin8 (heartbeat from the display?) and a delayed pulse on pin6 about 15ms after each data transmission
Here is a zoomed-in trace for one of the data transmissions:

So definitely SPI style with a rising edge 2.4 MHz clock on pin5 and data on pin4. By default, the display powers on with the top-left led lit. The ’80’ byte in the first set of data suggests the data is being sent left-to-right, top-to-bottom, MSB first. The pixel data is gated by pin3 (active low). Each row of display data is preceded by a header, ‘3E’ for the first row and ‘BE’ for the second. Header data is gated by pin2 (Active High). Some further experiments showed that pin7 accepts an analog voltage to set the display brightness (0-5V).
In summary the function of the connector pins is:
- GND
- HEADER_SEL (Active high)
- PIXEL_SEL (Active low)
- DATA (Idle high)
- CLK (Idle high, rising edge, 2.4MHz)
- EOT (End of data transmission)
- BRIGHTNESS (analog 0=on 3V = off)
- HEARTBEAT? (100Hz pulses from the display)
Now we have enough info to create a prototype. I used a Wemos D1 Mini (ESP8266) which has hardware SPI and WiFi support. 5V power is available from the sign itself so no other hardware is needed. Here are the pin mappings:
| Hanover Pin | Wemos Pin |
| 1 | GND |
| 2 | D1 |
| 3 | D2 |
| 4 | D7 (MOSI) |
| 5 | D5 (SCK) |
| 6 | D3 |
| 7 | D4 |
| 8 | Unused |
Some code was written to implement the above protocol. It subscribes to the MQTT topics “hanoverled/display” (64 bytes of display data) and “hanoverled/brightness” (0-1023) and updates the display as these topics change.
Here is an extract of the code showing the main display routine. It accepts 64 bytes of data being the pixel values in left-to-right, top-to-bottom order. Not sure what the header values mean so just used the captured values 3E and BE. The ‘EOT’ pulse at the end of transmission is required otherwise the display does not update properly.
void UpdateDisplay(byte data[64])
{
   SPI.beginTransaction(SPISettings(2500000, MSBFIRST, SPI_MODE2));

   // meta data row 1
   digitalWrite(MS, HIGH);
   SPI.transfer(0x3E);
   digitalWrite(MS, LOW);

   // pixel data row 1
   for(int i = 0; i < 32; i++)
   {
      digitalWrite(DS, LOW);
      SPI.transfer(data[i]);
      digitalWrite(DS, HIGH);
   }

   // meta data row 2
   digitalWrite(MS, HIGH);
   SPI.transfer(0xBE);
   digitalWrite(MS, LOW);

   // pixel data row 2
   for(int i = 32; i < 64; i++)
   {
      digitalWrite(DS, LOW);
      SPI.transfer(data[i]);
      digitalWrite(DS, HIGH);
   }
   SPI.endTransaction();

   // pulse EOT line
   delay(15);
   digitalWrite(EOT, HIGH);
   digitalWrite(EOT, LOW);
}
To test the display a version of Conway’s game of life was written. Random start populations are generated, evolved and sent to the MQTT “hanoverled/display” topic. The program generates a new population if a game starts to repeat.
Here is a video of the sign in operation: